SPARQL and Instacart's Knowledge Graph
Managing data quality.

Two recent articles describe a fascinating use of SPARQL to improve data quality in a knowledge graph at the successful grocery delivery service Instacart. On Reliability Scores for Knowledge Graphs (pdf) is a short paper submitted to the 2022 ACM Web Conference in Lyon and a longer piece on Instacart’s tech blog is titled Red Means Stop. Green Means Go: A Look into Quality Assessment in Instacart’s Knowledge Graph.
The abstract from the Web Conference paper gives an overview of the goal:
The Instacart KG is a central data store which contains facts regarding grocery products, ranging from taxonomic classifications to product nutritional information. With a view towards providing reliable and complete information for downstream applications, we propose an automated system for providing these facts with a score based on their reliability. This system passes data through a series of contextualized unit tests; the outcome of these tests are aggregated in order to provide a fact with a discrete score: reliable, questionable, or unreliable. These unit tests are written with explainability, scalability, and correctability in mind.
They “propose an automated system” that the tech blog piece shows is successfully in production. To quote more from the Web Conference paper’s introduction:
The Instacart KG contains information regarding products, recipes, and various product attributes, together with millions of contextual facts regarding these entities… Due to their large scale it is infeasible to curate such graphs by hand. Because of this, automated quality control mechanisms are important to ensure KGs contain valid information. Often KGs are created through a series of automated ETL processes which analyze both structured and unstructured data from a variety of sources to generate facts for the graph. This automation, combined with questionable source data, can cause KGs to acquire noise in the form of incorrect statements during their build processes. This noise can present itself in a variety of ways: incorrect product attributes can lead to negative storefront interactions, and noisy training sets can lead to less precise machine learning models. This has led to much work regarding quality assessment, error detection, and error correction in knowledge graphs.
As the tech blog put it, this system “helps us preemptively discover and flag flaws in our data which can then be corrected at the source [and] acts as a basic guardrail which prevents noisy and unreliable data from being published and corrupting downstream processes”.
They store their knowledge graph data as RDF triples in AWS Neptune. They evaluate and record the quality of facts with the following steps:
- Use SPARQL to retrieve a set of data such as nutritional information.
- Run the retrieved data through a series of Python unit tests designed for that dataset and log the results.
- Tag facts as being either reliable, questionable, or unreliable.
- Use SPARQL Update to record the results in the named graphs ReliableKG, QuestionableKG, and UnreliableKG.
With this system in place, downstream applications within the company can use more reliable data or just more data as appropriate for their needs. According to the Web Conference paper, “It is trivially easy to restrict a KG query to only select data which is at or above a certain reliability score”.
The tests in step 2 might flag something that is marked as Vegan but not Vegetarian so that someone can check whether it really is Vegan and set its Vegetarian value to True if so. The Web Conference paper includes other examples of how different classes of tests such as identification of outliers (for example, a dessert with an abnormally large amount of protein per serving, or items with an unreasonable sugar-carbohydrate ratio) led to more data quality. Because of this paper’s academic orientation, it also includes an “Impact Analysis” section about how they quantified the improvements to data quality, as well as references to previous academic work on data quality.
According to the tech blog, another benefit of their pipeline is that the system can pass the logs “to upstream data providers to make it easier to find and correct data inaccuracies at the source”.
Another part of their knowledge graph that provides metadata about the products is a taxonomy that, according to the article’s author Thomas Grubb, is represented in RDF as rdfs:class instances with rdfs:subClassOf relationships. This taxonomy drives some of the rules used to identify data problems. It also provides input to machine learning steps that help to identify new relationships about items; this process uses word embeddings (which I described in Document analysis with machine learning) and the k-Nearest Neighbors algorithm to identify taxonomy classifications based on product names.
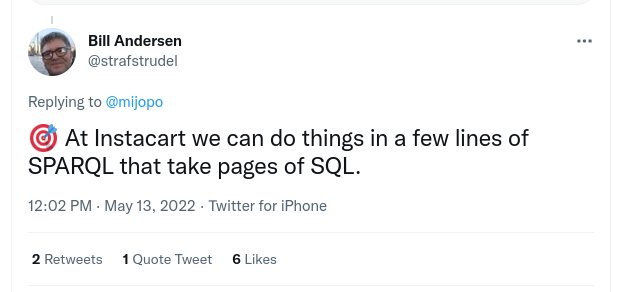
It’s great to see SPARQL play such an important role in a powerful, useful system that takes advantage of several other interesting technologies. I especially like seeing their use of SPARQL Update—between the “QL” in “SPARQL” and the way that Wikidata is driving much of SPARQL’s current popularity, many people don’t realize that SPARQL is not a read-only technology. I also loved seeing a well-known brand name use and publicize SPARQL’s power, as you can see in this tweet:
Comments? Reply to my tweet announcing this blog entry.
Share this post